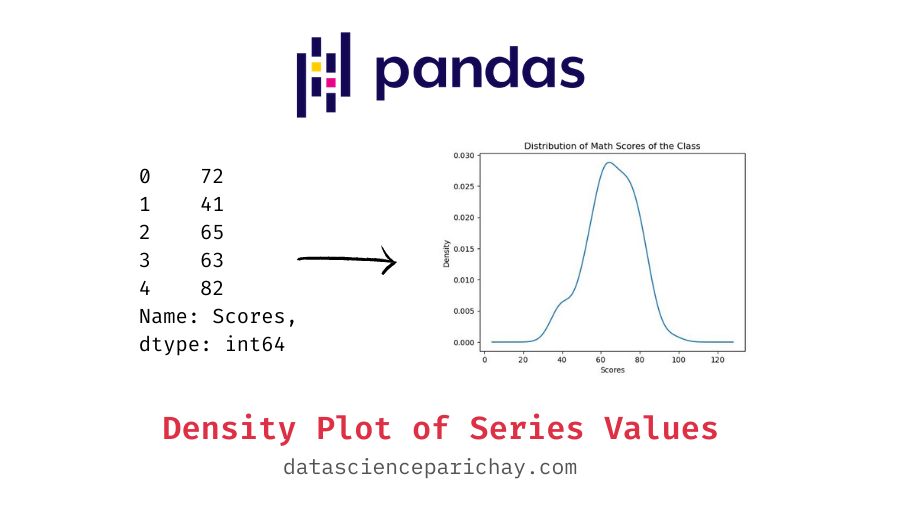
Create a Density Plot from Pandas Series Values
In this tutorial, we will look at how to create a density plot of a pandas series values. Pandas Series as Density Plot To plot a pandas series, you can use the pandas series plot() function. It plots a line chart of the series values by default but you can specify the type of chart to plot […]
Create a Density Plot from Pandas Series Values Read More »