In this tutorial, we will look at how to get the summary statistics for a Pyspark dataframe with the help of some examples.
How to get the summary statistics of a Pyspark dataframe?
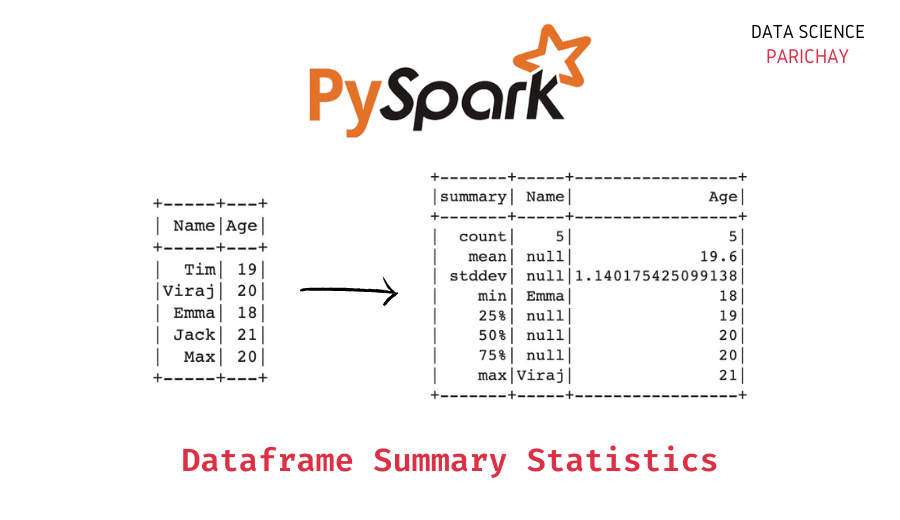
You can use the Pyspark dataframe summary() function to get the summary statistics for a dataframe in Pyspark. The following is the syntax –
# dataframe summary statistics
df.summary().show()
The summary() function is commonly used in exploratory data analysis. It shows statistics like the count, mean, standard deviation, min, max, and common percentiles (for example, 25th, 50th, and 75th) of values in each column of the dataframe.
Examples
Let’s look at some examples of getting dataframe statistics from a Pyspark dataframe. First, we’ll create a Pyspark dataframe that we will be using throughout this tutorial.
# import the pyspark module
import pyspark

# import the  sparksession class  from pyspark.sql
from pyspark.sql import SparkSession

# create an app from SparkSession class
spark = SparkSession.builder.appName('datascience_parichay').getOrCreate()

# data of competition participants
data = [["Tim", 19, 172, "M"],
        ["Viraj", 20, 186, "L"],
        ["Emma", 18, 168, "M"],
        ["Jack", 21, 166, "S"],
        ["Max", 20, 173, "M"]]

# create a Pyspark dataframe using the above data
df = spark.createDataFrame(data, ["Name", "Age", "Height", "Shirt Size"])

# display the dataframe
df.show()
Output:
+-----+---+------+----------+
| Name|Age|Height|Shirt Size|
+-----+---+------+----------+
|  Tim| 19|   172|         M|
|Viraj| 20|   186|         L|
| Emma| 18|   168|         M|
| Jack| 21|   166|         S|
|  Max| 20|   173|         M|
+-----+---+------+----------+
We now have a dataframe containing the name, age, height, and t-shirt size of some students participating in a sports contest.
Summary stats for the entire dataframe in Pyspark
Let’s get the summary statistics for the above dataframe. For this, apply the summary() function on the dataframe and then use the show() function to display the results.
# display dataframe summary
df.summary().show()
Output:
Introductory ⭐
- Harvard University Data Science: Learn R Basics for Data Science
- Standford University Data Science: Introduction to Machine Learning
- UC Davis Data Science: Learn SQL Basics for Data Science
- IBM Data Science: Professional Certificate in Data Science
- IBM Data Analysis: Professional Certificate in Data Analytics
- Google Data Analysis: Professional Certificate in Data Analytics
- IBM Data Science: Professional Certificate in Python Data Science
- IBM Data Engineering Fundamentals: Python Basics for Data Science
Intermediate ⭐⭐⭐
- Harvard University Learning Python for Data Science: Introduction to Data Science with Python
- Harvard University Computer Science Courses: Using Python for Research
- IBM Python Data Science: Visualizing Data with Python
- DeepLearning.AI Data Science and Machine Learning: Deep Learning Specialization
Advanced ⭐⭐⭐⭐⭐
- UC San Diego Data Science: Python for Data Science
- UC San Diego Data Science: Probability and Statistics in Data Science using Python
- Google Data Analysis: Professional Certificate in Advanced Data Analytics
- MIT Statistics and Data Science: Machine Learning with Python - from Linear Models to Deep Learning
- MIT Statistics and Data Science: MicroMasters® Program in Statistics and Data Science
🔎 Find Data Science Programs 👨💻 111,889 already enrolled
Disclaimer: Data Science Parichay is reader supported. When you purchase a course through a link on this site, we may earn a small commission at no additional cost to you. Earned commissions help support this website and its team of writers.
+-------+-----+-----------------+-----------------+----------+
|summary| Name|              Age|           Height|Shirt Size|
+-------+-----+-----------------+-----------------+----------+
|  count|    5|                5|                5|         5|
|   mean| null|             19.6|            173.0|      null|
| stddev| null|1.140175425099138|7.810249675906654|      null|
|    min| Emma|               18|              166|         L|
|    25%| null|               19|              168|      null|
|    50%| null|               20|              172|      null|
|    75%| null|               20|              173|      null|
|    max|Viraj|               21|              186|         S|
+-------+-----+-----------------+-----------------+----------+
You can see that we get summary statistics for all the columns in the dataframe. Note that for the non-numerical columns (“Name” and “Shirt Size”), we get null for mean, standard deviation, and percentile values as these cannot be computed for string values.
Alternatively, you can also use the Pyspark dataframe describe() function to get some summary statistics. Let’s apply this function to the above dataframe.
# summary stats using describe()
df.describe().show()
Output:
+-------+-----+-----------------+-----------------+----------+
|summary| Name|              Age|           Height|Shirt Size|
+-------+-----+-----------------+-----------------+----------+
|  count|    5|                5|                5|         5|
|   mean| null|             19.6|            173.0|      null|
| stddev| null|1.140175425099138|7.810249675906654|      null|
|    min| Emma|               18|              166|         L|
|    max|Viraj|               21|              186|         S|
+-------+-----+-----------------+-----------------+----------+
We get a selection of statistics that we got from the summary() function. Note that the describe() function doesn’t give the common percentile values (25%, 50%, and 75%).
You might also be interested in –
- Print Pyspark DataFrame Schema
- Pyspark – Standard Deviation of a Column
- Aggregate Functions in PySpark
Subscribe to our newsletter for more informative guides and tutorials.
We do not spam and you can opt out any time.