In this tutorial, we will look at how to get the mean of one or more columns in a pandas dataframe.
How to calculate the mean of pandas column?
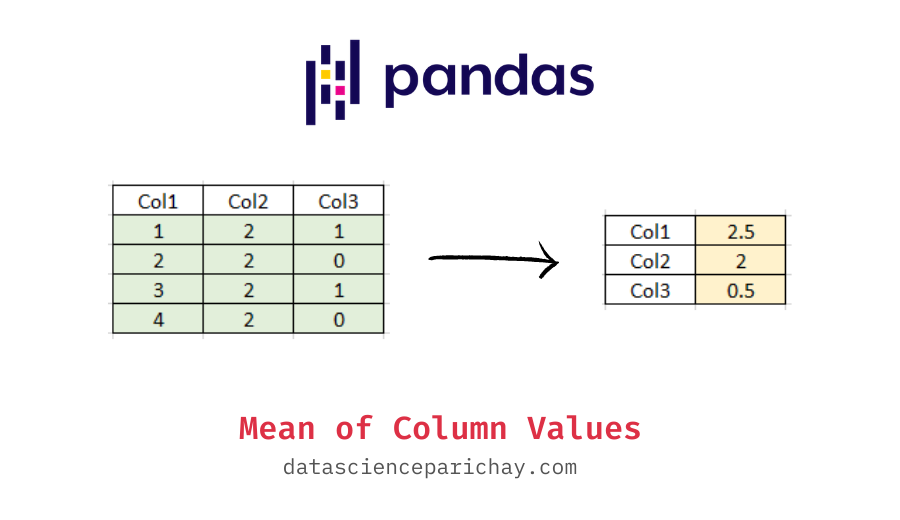
You can use the pandas series mean() function to get the mean of a single column or the pandas dataframe mean() function to get the mean of all numerical columns in the dataframe. The following is the syntax:
# mean of single column
df['Col'].mean()
# mean of all numerical columns in dataframe
df.mean()
Let’s create a sample dataframe that we will be using throughout this tutorial to demonstrate the usage of the methods and syntax mentioned.
import pandas as pd

# create a dataframe
df = pd.DataFrame({
    'sepal_length': [5.1, 4.9, 4.7, 4.6, 5.0, 5.4, 4.6, 5.0],
    'sepal_width': [3.5, 3.0, 3.2, 3.1, 3.6, 3.9, 3.4, 3.4],
    'petal_length': [1.4, 1.4, 1.3, 1.5, 1.4, 1.7, 1.4, 1.5],
    'petal_width': [0.2, 0.2, 0.2, 0.2, 0.2, 0.4, 0.3, 0.2],
    'sepices': ['setosa']*8
})
# display the dataframe
print(df)
Output:
   sepal_length  sepal_width  petal_length  petal_width sepices
0          5.1          3.5           1.4          0.2  setosa
1          4.9          3.0           1.4          0.2  setosa
2          4.7          3.2           1.3          0.2  setosa
3          4.6          3.1           1.5          0.2  setosa
4          5.0          3.6           1.4          0.2  setosa
5          5.4          3.9           1.7          0.4  setosa
6          4.6          3.4           1.4          0.3  setosa
7          5.0          3.4           1.5          0.2  setosa
The sample dataframe is taken form a section of the Iris dataset. This sample has petal and sepal dimensions of eight data points of the “Setosa” species.
Mean of a single column
First, let’s see how to get the mean of a single dataframe column.
You can use the pandas series mean() function to get the mean of individual columns (which essentially are pandas series). For example, let’s get the mean of the “sepal_length” column in the above dataframe.
# mean of sepal_length column
print(df['sepal_length'].mean())
Output:
Introductory ⭐
- Harvard University Data Science: Learn R Basics for Data Science
- Standford University Data Science: Introduction to Machine Learning
- UC Davis Data Science: Learn SQL Basics for Data Science
- IBM Data Science: Professional Certificate in Data Science
- IBM Data Analysis: Professional Certificate in Data Analytics
- Google Data Analysis: Professional Certificate in Data Analytics
- IBM Data Science: Professional Certificate in Python Data Science
- IBM Data Engineering Fundamentals: Python Basics for Data Science
Intermediate ⭐⭐⭐
- Harvard University Learning Python for Data Science: Introduction to Data Science with Python
- Harvard University Computer Science Courses: Using Python for Research
- IBM Python Data Science: Visualizing Data with Python
- DeepLearning.AI Data Science and Machine Learning: Deep Learning Specialization
Advanced ⭐⭐⭐⭐⭐
- UC San Diego Data Science: Python for Data Science
- UC San Diego Data Science: Probability and Statistics in Data Science using Python
- Google Data Analysis: Professional Certificate in Advanced Data Analytics
- MIT Statistics and Data Science: Machine Learning with Python - from Linear Models to Deep Learning
- MIT Statistics and Data Science: MicroMasters® Program in Statistics and Data Science
🔎 Find Data Science Programs 👨💻 111,889 already enrolled
Disclaimer: Data Science Parichay is reader supported. When you purchase a course through a link on this site, we may earn a small commission at no additional cost to you. Earned commissions help support this website and its team of writers.
4.9125
You see that we get the mean of all values in the “sepal_length” column as the scaler value 4.9125.
Mean of more than one columns
To get the mean of multiple columns together, first, create a dataframe with the columns you want to calculate the mean for and then apply the pandas dataframe mean() function. For example, let’s get the mean of the columns “petal_length” and “petal_width”
# mean of more than one columns
print(df[['petal_length', 'petal_width']].mean())
Output:
petal_length    1.4500
petal_width     0.2375
dtype: float64
We get the result as a pandas series. Here, we first created a subset of the dataframe “df” with only the columns “petal_length” and “petal_width” and then applied the mean function.
Mean of all the columns
To get the mean of all the columns, use the same method as above but this time on the entire dataframe. Let’s use this function on the dataframe “df” created above.
# mean of all the columns
print(df.mean())
Output:
sepal_length    4.9125
sepal_width     3.3875
petal_length    1.4500
petal_width     0.2375
dtype: float64
You can see that we get the mean of all the numerical columns present in the dataframe.
Note that you can also use the pandas describe() function to look at statistics including the mean of columns in the dataframe.
# get dataframe statistics
df.describe()
Output:

For more on the pandas dataframe mean() function, refer to its documention.
With this, we come to the end of this tutorial. The code examples and results presented in this tutorial have been implemented in a Jupyter Notebook with a python (version 3.8.3) kernel having pandas version 1.0.5
Subscribe to our newsletter for more informative guides and tutorials.
We do not spam and you can opt out any time.
Tutorials on getting statistics for pandas dataframe values –
- Pandas – Get Mean of one or more Columns
- Pandas – Get Standard Deviation of one or more Columns
- Pandas – Get Median of One or More Columns
- Get correlation between columns of Pandas DataFrame
- Cumulative Sum of Column in Pandas DataFrame
- Pandas – Count Missing Values in Each Column
- Get Rolling Window estimates in Pandas
- Get the number of rows in a Pandas DataFrame
- Pandas – Count of Unique Values in Each Column