A dataframe in R is a data structure used to store tabular data in rows and columns. In this tutorial, we will look at how to count the unique values in a column of an R dataframe with the help of some examples.
How do you get the unique values count of an R dataframe column?
You can use a combination of the length() function and the unique() function in R to get the count of unique values in a dataframe column.
The idea is to first get the unique values from the column in a vector using the unique() function and then apply length() function on this unique values vector to get a count of the unique values in the column.
The following is the syntax –
length(unique(dataframe[[columan_name]]))
We get the unique values count in the column as an integer.
Steps to count distinct values in an R dataframe column
Let’s now look at the steps to follow to get distinct values in a dataframe column in R
Step 1 – Create a dataframe
First, we will create a dataframe that we will be using throughout this tutorial.
# create a dataframe
employees_df = data.frame(
  "Name"= c("Jim", "Dwight", "Angela", "Tobi", "Kevin"),
  "Age"= c(26, 28, 29, 32, 30),
  "Department"= c("Sales", "Sales", "Accounting", "HR", "Accounting")
)
# display the dataframe
print(employees_df)
Output:
Introductory ⭐
- Harvard University Data Science: Learn R Basics for Data Science
- Standford University Data Science: Introduction to Machine Learning
- UC Davis Data Science: Learn SQL Basics for Data Science
- IBM Data Science: Professional Certificate in Data Science
- IBM Data Analysis: Professional Certificate in Data Analytics
- Google Data Analysis: Professional Certificate in Data Analytics
- IBM Data Science: Professional Certificate in Python Data Science
- IBM Data Engineering Fundamentals: Python Basics for Data Science
Intermediate ⭐⭐⭐
- Harvard University Learning Python for Data Science: Introduction to Data Science with Python
- Harvard University Computer Science Courses: Using Python for Research
- IBM Python Data Science: Visualizing Data with Python
- DeepLearning.AI Data Science and Machine Learning: Deep Learning Specialization
Advanced ⭐⭐⭐⭐⭐
- UC San Diego Data Science: Python for Data Science
- UC San Diego Data Science: Probability and Statistics in Data Science using Python
- Google Data Analysis: Professional Certificate in Advanced Data Analytics
- MIT Statistics and Data Science: Machine Learning with Python - from Linear Models to Deep Learning
- MIT Statistics and Data Science: MicroMasters® Program in Statistics and Data Science
🔎 Find Data Science Programs 👨💻 111,889 already enrolled
Disclaimer: Data Science Parichay is reader supported. When you purchase a course through a link on this site, we may earn a small commission at no additional cost to you. Earned commissions help support this website and its team of writers.
    Name Age Department
1    Jim  26      Sales
2 Dwight  28      Sales
3 Angela  29 Accounting
4   Tobi  32         HR
5  Kevin  30 Accounting
We now have a dataframe containing information about some employees working in an office. The dataframe has columns “Name”, “Age”, and “Department”.
Step 2 – Get the count of the unique values in the column using unique() and length()
To get the unique value count in a column, pass the column values vector to the unique() function as an argument. You can use the [[]] notation to get a column’s values vector. This will result in a vector of unique values from the column.
Then, you can then apply the length() function on this vector of unique values to get the unique values count.
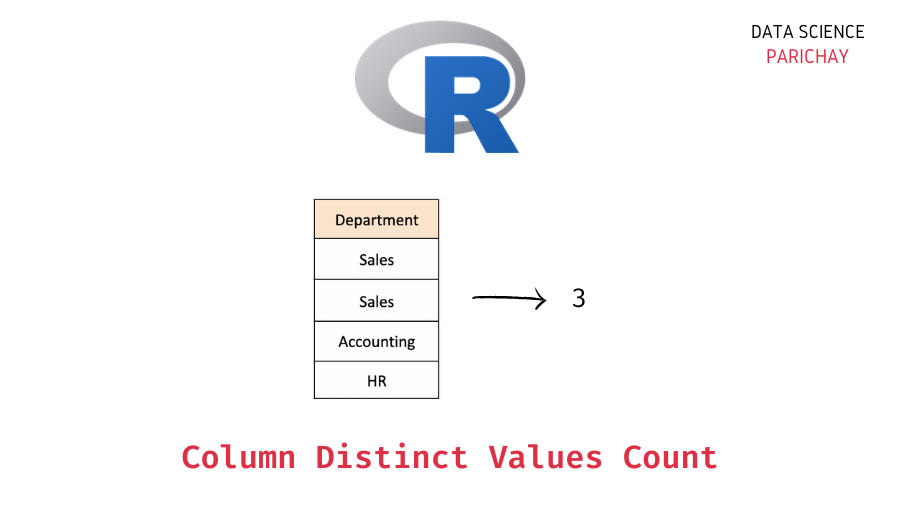
Let’s get the count of distinct departments from the “Department” column in the above dataframe.
# get count of distinct values in "Department" column
dept_count <- length(unique(employees_df[["Department"]]))
# display the result
print(dept_count)
Output:
[1] 3
We get the number of unique values in the “Department” column as 3.
Note that you can also use the column index to access a column’s values. For example, in the above dataframe, the index of the “Department” column is 3 (rows and columns in R are indexed starting from 1).
# get count of distinct values in "Department" column
dept_count <- length(unique(employees_df[[3]]))
# display the result
print(dept_count)
Output:
[1] 3
We get the same result as above.
Summary
In this tutorial, we looked at how to count the unique values in the column in an R dataframe. The following is a short summary of the steps –
- Create a dataframe (skip this step if you already have a dataframe on which you want to operate).
- Use a combination of the
unique()and thelength()functions in R to count the unique values in a column.
You might also be interested in –
- Create a DataFrame in R
- How to Add a Row to a Dataframe in R?
- How to Add a Column to a Dataframe in R?
Subscribe to our newsletter for more informative guides and tutorials.
We do not spam and you can opt out any time.