Pandas is a versatile data manipulation library in Python. It allows you to perform a number of different operations to clean, modify, and/or extract insights from the underlying tabular data. You can use Pandas groupby to group the underlying data on one or more columns and estimate useful statistics like count, mean, median, etc. In this tutorial, we will look at how to compute the median of each group in pandas groupby.
Pandas Groupby Median
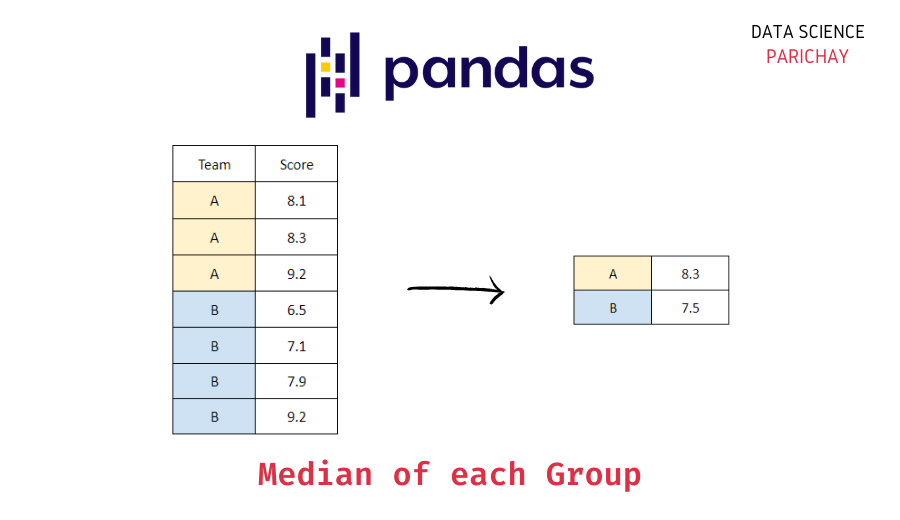
To get the median of each group, you can directly apply the pandas median() function to the selected columns from the result of pandas groupby. The following is a step-by-step guide of what you need to do.
- Group the dataframe on the column(s) you want.
- Select the field(s) for which you want to estimate the median.
- Apply the pandas
median()function directly or pass ‘median’ to theagg()function.
The following is the syntax –
# groupby columns Col1 and estimate the median of column Col2
df.groupby([Col1])[Col2].median()
# alternatively, you can pass 'median' to the agg() function
df.groupby([Col1])[Col2].agg('median')
Examples
Let’s look at the usage of the above syntax with the help of some examples. First, we will create a sample dataframe that we will be using throughout this tutorial.
import pandas as pd

# create a dataframe of car models by two companies
df = pd.DataFrame({
    'Company': ['A', 'A', 'A', 'B', 'B', 'B', 'B'],
    'Model': ['A1', 'A2', 'A3', 'B1', 'B2', 'B3', 'B4'],
    'Year': [2019, 2020, 2021, 2018, 2019, 2020, 2021],
    'Transmission': ['Manual', 'Automatic', 'Automatic', 'Manual', 'Automatic', 'Automatic', 'Manual'],
    'EngineSize': [1.4, 2.0, 1.4, 1.5, 2.0, 1.5, 1.5],
    'MPG': [55.4, 67.3, 58.9, 52.3, 64.2, 68.9, 83.1]
})
# display the dataframe
df
Output:

Here we created a dataframe storing the specifications of the car models by two different companies. The “EngineSize” column is the size of the engine in litres and the “MPG” is the mileage of the car in miles-per-gallon.
1. Groupby Median of a single column
Let’s compute the median mileage of the cars from the two companies. For this, we need to group the data on “Company” and then calculate the median of the “MPG” column.
# median MPG for each Company
df.groupby('Company')['MPG'].median()
Output:
Introductory ⭐
- Harvard University Data Science: Learn R Basics for Data Science
- Standford University Data Science: Introduction to Machine Learning
- UC Davis Data Science: Learn SQL Basics for Data Science
- IBM Data Science: Professional Certificate in Data Science
- IBM Data Analysis: Professional Certificate in Data Analytics
- Google Data Analysis: Professional Certificate in Data Analytics
- IBM Data Science: Professional Certificate in Python Data Science
- IBM Data Engineering Fundamentals: Python Basics for Data Science
Intermediate ⭐⭐⭐
- Harvard University Learning Python for Data Science: Introduction to Data Science with Python
- Harvard University Computer Science Courses: Using Python for Research
- IBM Python Data Science: Visualizing Data with Python
- DeepLearning.AI Data Science and Machine Learning: Deep Learning Specialization
Advanced ⭐⭐⭐⭐⭐
- UC San Diego Data Science: Python for Data Science
- UC San Diego Data Science: Probability and Statistics in Data Science using Python
- Google Data Analysis: Professional Certificate in Advanced Data Analytics
- MIT Statistics and Data Science: Machine Learning with Python - from Linear Models to Deep Learning
- MIT Statistics and Data Science: MicroMasters® Program in Statistics and Data Science
🔎 Find Data Science Programs 👨💻 111,889 already enrolled
Disclaimer: Data Science Parichay is reader supported. When you purchase a course through a link on this site, we may earn a small commission at no additional cost to you. Earned commissions help support this website and its team of writers.
Company
A    58.90
B    66.55
Name: MPG, dtype: float64
You can see that we get the median “MPG” for each “Company” in df. It shows that on a median level, the mileage of cars from company B is better than cars from Company A.
Alternatively, you can also use the pandas agg() function on the resulting groups.
# median MPG for each Company
df.groupby('Company')['MPG'].agg('median')
Output:
Company
A    58.90
B    66.55
Name: MPG, dtype: float64
We get the same results as above.
You can also, group the above data by multiple columns. For example, let’s group the data on “Company” and “Transmission” to get the median “MPG” for each group.
# median MPG for each Company
df.groupby(['Company', 'Transmission'])['MPG'].median()
Output:
Company  Transmission
A        Automatic       63.10
         Manual          55.40
B        Automatic       66.55
         Manual          67.70
Name: MPG, dtype: float64
2. Groupby Median of multiple columns
You can also get the median of multiple columns at a time for each group resulting from the groupby. For example, let’s get the median “MPG” and “EngineSize” for each “Company” in df.
# median MPG and EngineSize for each Company
df.groupby('Company')[['MPG', 'EngineSize']].median()
Output:

Here we selected the columns that we wanted to compute the median on from the resulting groupby object and then applied the pandas median() function.
Let’s now do the same thing with the pandas agg() function.
# median MPG and EngineSize for each Company
df.groupby('Company')[['MPG', 'EngineSize']].agg('median')
Output:
We get the same results as above.
With this, we come to the end of this tutorial. The code examples and results presented in this tutorial have been implemented in a Jupyter Notebook with a python (version 3.8.3) kernel having pandas version 1.0.5
Subscribe to our newsletter for more informative guides and tutorials.
We do not spam and you can opt out any time.