In this tutorial, we will look at the syntax and usage of the numpy logspace function with the help of some examples.
What is numpy logspace() used for?
The numpy logspace() function is used to create an array of equally spaced values between two numbers on the logarithmic scale. The following is the syntax:
import numpy as np

# np.logspace with all the default parameters
arr = np.logspace(start, stop, num=50, endpoint=True, base=10.0, dtype=None, axis=0)

# mostly you'll be only using these paramters
arr = np.linspace(start, stop, num, base)
It returns a numpy array of equally spaced values on the log scale between start and stop (both included). This function is similar to the numpy linspace() function which creates an array of equally spaced values on the linear scale.
Like the linspace() function, you can also customize the usage of the logspace() function such as –
- You can exclude the
stopvalue from the resulting array by passingFalseto theendpointparameter which isTrueby default. - You can also specify the number of values you want to generate by passing it to the
numparameter which is 50 by default. - The dtype of the output array is inferred from the start and stop values. Note that, the inferred type will never be an integer, float is chosen even if the arguments would produce an array of integers. You can, however, specify the dtype if you don’t want it to be inferred.
- Additionally, you can specify the base of the log space you want to use with the
baseparameter which is 10 by default.
Numpy logspace() Examples
Let’s look at the usage of the logspace() function with the help of some examples.
1. Equally spaced numbers on the log scale
Let’s create an array of equally spaced numbers on the log scale between 1 and 2.
import numpy as np

# equally spaced values on log scale between 1 and 2
arr = np.logspace(1, 2)
# display the resulting array
print(arr)
Output:
[ 10.          10.48113134  10.98541142  11.51395399  12.06792641
  12.64855217  13.25711366  13.89495494  14.56348478  15.26417967
  15.9985872   16.76832937  17.57510625  18.42069969  19.30697729
  20.23589648  21.20950888  22.22996483  23.29951811  24.42053095
  25.59547923  26.82695795  28.11768698  29.47051703  30.88843596
  32.37457543  33.93221772  35.56480306  37.2759372   39.06939937
  40.94915062  42.9193426   44.98432669  47.14866363  49.41713361
  51.79474679  54.28675439  56.89866029  59.63623317  62.50551925
  65.51285569  68.6648845   71.9685673   75.43120063  79.06043211
  82.86427729  86.85113738  91.0298178   95.40954763 100.        ]
You can see that we get 50 values in the returned array. In linear space, the sequence starts at base ** start (base to the power of start) and ends with base ** stop. These values are equally spaced on the log scale.
Introductory ⭐
- Harvard University Data Science: Learn R Basics for Data Science
- Standford University Data Science: Introduction to Machine Learning
- UC Davis Data Science: Learn SQL Basics for Data Science
- IBM Data Science: Professional Certificate in Data Science
- IBM Data Analysis: Professional Certificate in Data Analytics
- Google Data Analysis: Professional Certificate in Data Analytics
- IBM Data Science: Professional Certificate in Python Data Science
- IBM Data Engineering Fundamentals: Python Basics for Data Science
Intermediate ⭐⭐⭐
- Harvard University Learning Python for Data Science: Introduction to Data Science with Python
- Harvard University Computer Science Courses: Using Python for Research
- IBM Python Data Science: Visualizing Data with Python
- DeepLearning.AI Data Science and Machine Learning: Deep Learning Specialization
Advanced ⭐⭐⭐⭐⭐
- UC San Diego Data Science: Python for Data Science
- UC San Diego Data Science: Probability and Statistics in Data Science using Python
- Google Data Analysis: Professional Certificate in Advanced Data Analytics
- MIT Statistics and Data Science: Machine Learning with Python - from Linear Models to Deep Learning
- MIT Statistics and Data Science: MicroMasters® Program in Statistics and Data Science
🔎 Find Data Science Programs 👨💻 111,889 already enrolled
Disclaimer: Data Science Parichay is reader supported. When you purchase a course through a link on this site, we may earn a small commission at no additional cost to you. Earned commissions help support this website and its team of writers.
2. Specifying the number of samples
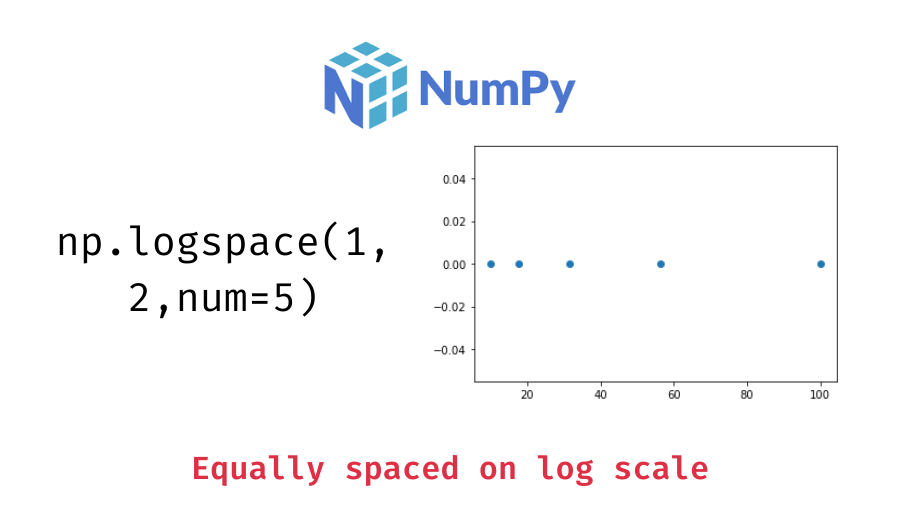
In the previous example, we specified the start and stop values and used all the default parameters. Let’s now specify the number of equally spaced values we want. For example, let’s generate 5 equally values on the log scale between 1 and 2.
# five equally spaced values on log scale between 1 and 2
arr = np.logspace(1, 2, num=5)
# display the resulting array
print(arr)
Output:
[ 10. 17.7827941 31.6227766 56.23413252 100. ]
We get five values between 10 (base to the power 1, the start value) and 100 (base to the power 2, the stop value). If you don’t want the stop endpoint to be included, pass False to the endpoint parameter.
# exclude the stop endpoint
arr = np.logspace(1, 2, num=5, endpoint=False)
# display the resulting array
print(arr)
Output:
[10. 15.84893192 25.11886432 39.81071706 63.09573445]
3. Using a different base for the log scale
The np.logspace() function uses 10 as the default base for the log scale. We can change that with the base parameter. For example, let’s generate 5 equally spaced values on the log scale between 1 and 2 but using 2 as the base for the log scale this time.
# using 2 as base for the log scale
arr = np.logspace(1, 2, num=5, base=2)
# display the resulting array
print(arr)
Output:
[2. 2.37841423 2.82842712 3.36358566 4. ]
We can see that now the resulting values are between 2 (base to the power 1) and 4 (base to the power 2).
4. Visualizing the results from numpy logspace()
How do you confirm that the numbers generated are actually equally spaced on the log scale?
One of the ways to do it is to visualize the values on a plot. For example, let’s plot the values returned from the np.logspace() function.
import matplotlib.pyplot as plt

x1 = np.logspace(1, 2, num=5)
y1 = np.zeros(5)

# plot the values
plt.plot(x1, y1, 'o')
Output:

You can see that the values grow wider apart as we move along the x-axis. This is because these values are equally spaced on the log scale and not the linear scale which we are viewing above. Let’s transform these values with a log transformation and then plot them.
# transform x1 to the log scale
x2 = np.log10(x1)
y2 = np.zeros(5)

# plot the values
plt.plot(x2, y2, 'o')
Output:

Now the values appear to be equally spaced since they have been transformed to the log scale.
For more on the numpy logspace() function, refer to its documentation.
With this, we come to the end of this tutorial. The code examples and results presented in this tutorial have been implemented in a Jupyter Notebook with a python (version 3.8.3) kernel having numpy version 1.18.5
Subscribe to our newsletter for more informative guides and tutorials.
We do not spam and you can opt out any time.